
How to Look Up Chesapeake Jail Population Data
Population data is different from a name search. It deals with counts, not single people. The most reliable local sources are the Sheriff's annual reports and the City of Chesapeake budget. The Sheriff's reports include a Correctional Center population section and operations data. The city budget shows staffing levels by office and year.
For broad context, federal and nonprofit research groups track jail trends across the country. These sources help you place a local number against state and national patterns. The Bureau of Justice Statistics is the main federal source for jail counts.
The federal jail data hub is a good starting point for national figures, on the Bureau of Justice Statistics site.
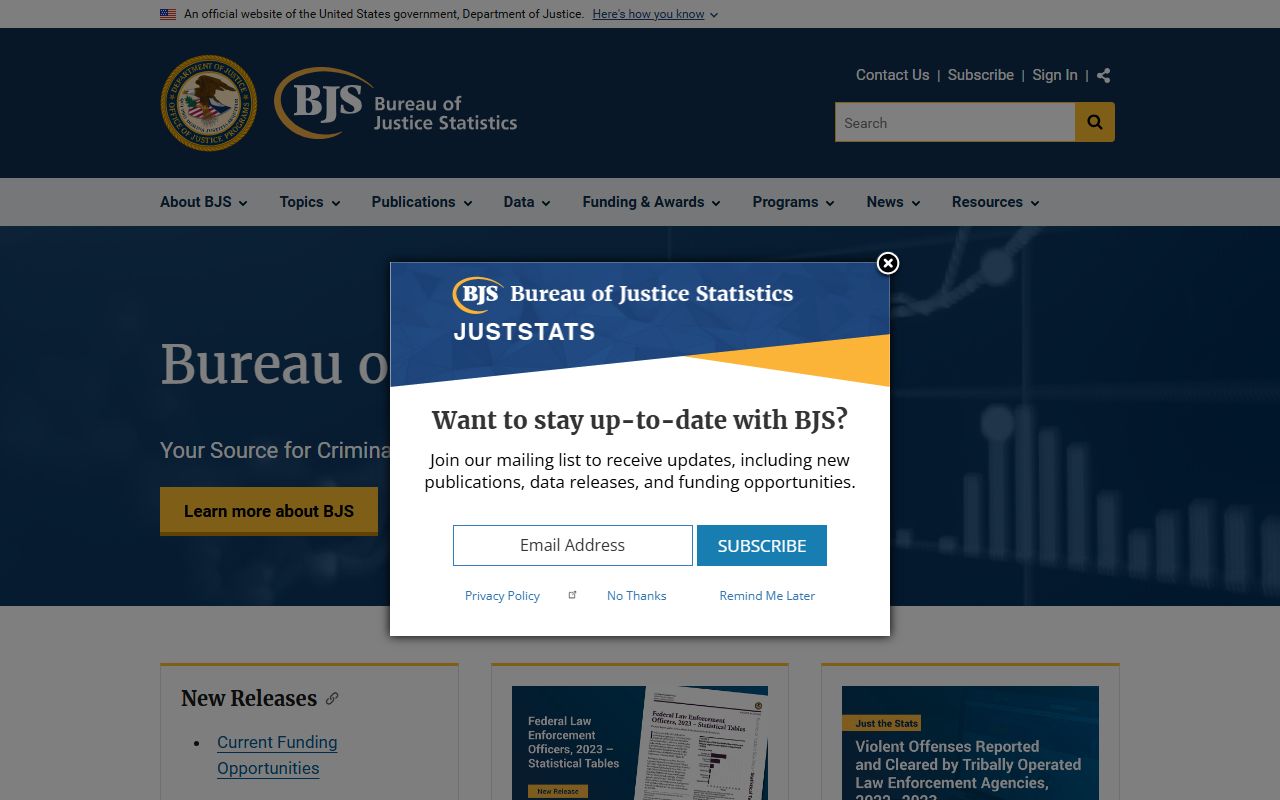
National data does not replace local reports, but it shows whether a local trend matches the broader picture.
Chesapeake Correctional Center Overview
The Chesapeake Correctional Center is the local jail for the city. It sits at 400 Albemarle Drive, near the courts. A local jail holds a different population than a state prison. It mixes people at several stages of a case, which makes the daily count move a lot.
The center handles intake, medical screening, housing, and programs. It also supports court operations, since many people held there have active cases in the nearby courts. For the live roster of who is held now, see the Chesapeake inmate records page.
Chesapeake Jail Capacity Overview
Capacity is the number of beds a jail is built to hold. The official capacity figure for the Chesapeake Correctional Center was not published in the accessible official text reviewed for this page. Third-party sites list conflicting numbers, so those are not repeated here. The Sheriff's annual reports are the place to confirm an official capacity and daily population.
| Facility | Address | Capacity / Population |
|---|---|---|
| Chesapeake Correctional Center | 400 Albemarle Drive, Chesapeake, VA 23322 | Official figure not published in accessible text; see Sheriff annual reports |
| Juvenile Services facility | Chesapeake | Separate from adult data; PREA and visitation rules apply |
Note: Confirm any capacity or daily population figure against the Sheriff's most recent annual report before treating it as official.
Sheriff Staffing and Budget
Staffing is a useful, well-documented proxy for the size of jail operations. The Chesapeake Sheriff's Office is a large constitutional-office operation in the city budget. The 2022 annual report said the office employed more than 400 trained law-enforcement individuals. The city's proposed budget shows staffing by year.
| Office | FY 2025 | FY 2026 | FY 2027 |
|---|---|---|---|
| Sheriff's Office (FTE) | 490.750 | 491.750 | 483.125 |
| Clerk of the Circuit Court (FTE) | 33.000 | 33.000 | 34.000 |
The Sheriff's staffing drops about 8.625 positions from FY 2026 to FY 2027, a change of roughly 1.8 percent. The Clerk's office rises by one position. These figures come from the city's proposed operating budget and the Sheriff's reports.
Programs and Work Crews
Population data is not only about counts. It also reflects what people do while held. The Sheriff's Office runs general education, substance-abuse treatment, counseling, religious services, recreation, and work programs for eligible inmates. Work crews handle tasks that save the city money.
The Sheriff's site has displayed public counters tied to operations, including 82,590 civil papers served and $358,482 in inmate work-crew savings at crawl time. Numbers like these change as the office updates them, so treat them as a snapshot rather than a fixed total.
Pretrial vs Sentenced Population
A local jail population splits into broad groups. Pretrial detainees are held while their cases move through court and have not been convicted. Sentenced inmates are serving short local terms after a conviction. The mix also includes probation or parole violators and state-responsible inmates waiting for transfer.
This split matters for reading any count. A jail with many pretrial detainees reflects court timing and bond decisions, not just sentencing. Because the groups shift daily, a single-day count can look very different from a yearly average. The Sheriff's annual report is the source for the local breakdown.
Average Daily Population
The single most useful jail number is the average daily population, often shortened to ADP. It smooths out the swings that a one-day count shows. A jail can book and release many people in a week, so a daily snapshot can mislead. The ADP gives a steadier measure of how full a facility runs.
The Sheriff's annual report is the official home for the Chesapeake ADP and booking totals. Because that figure is reported by year, the right move is to read the latest report and compare it with earlier ones. A rising or falling ADP tells more than any single headline count.
Demographic Breakdown
Jail data often includes a demographic breakdown by age, sex, and race. This helps researchers see who is held and whether the local pattern matches the wider region. The official Chesapeake breakdown was not extracted into accessible text for this page, so no specific shares are claimed here.
The honest path is to pull the breakdown from the Sheriff's annual report for the local view, then compare it with state and national shares from the research groups named below. Mixing a local count with a national share without labeling each one leads to bad conclusions, so keep the sources separate.
Misdemeanor vs Felony Population
Charge level shapes the population too. A local jail holds people on misdemeanors, people awaiting felony hearings, and state-responsible inmates waiting for transfer. The General District Court handles misdemeanors and preliminary felony hearings, while the Circuit Court handles felonies and appeals. The jail mix reflects that flow.
People held on a misdemeanor often serve shorter stays, while felony cases can mean longer pretrial holds. That difference affects both the daily count and the average. For the courts that drive these numbers, see the Chesapeake Circuit Court page.
Medical and Mental Health Population
A share of any jail population needs medical or mental-health care. The Chesapeake Correctional Center provides 24-hour care through an on-site contractor, screens inmates at booking, and runs a dedicated medical housing unit. It offers mental-health counseling, dental care, and chronic-condition treatment.
These services shape how the facility houses and manages people, since medical and mental-health needs affect placement. The official sources describe the services but do not publish a precise medical or mental-health population count, so that figure should come from the Sheriff's reports.
COVID-Era Operations
Recent years changed how the jail ran. The Sheriff's COVID-era annual report language describes operational changes and ongoing prevention steps. Those measures likely affected programs, visitation, and population management during that period.
For population trends, the pandemic is an important caveat. A dip or a shift in numbers during those years may reflect operational choices, not a lasting change in local crime or sentencing. Compare across several reports before drawing a trend line.
National and State Context
To judge a local number, compare it with broader data. The Bureau of Justice Statistics publishes national jail counts and rates. The Vera Institute tracks incarceration trends by locality. The Prison Policy Initiative builds state profiles that put local jails in a wider frame.
One nonprofit research hub for state profiles and incarceration data is the Prison Policy Initiative.

These groups report rates per 100,000 people, which lets you compare a small city with a large state. The Vera Institute, in particular, tracks jail and prison trends down to the locality level over many years. Pull the specific Chesapeake and Virginia figures from these sources rather than assuming a number, and label each figure as local, state, or national.
Population Trends Over Time
A trend needs more than one year of data. The strongest local approach uses several Sheriff's annual reports together, plus the city budget, to build a multi-year picture. The 2022 and 2023 reports and the latest budget are the core documents.
The exact multi-year daily-population table was not extracted for this page, so no trend numbers are stated here. That gap is honest and easy to fill: the Sheriff's reports carry the official population and booking figures needed to chart a real trend.
Searching Chesapeake Inmate Records by Name
This page is about counts, not individuals. To look up a specific person, the jail roster is the right tool, not the population data. The Chesapeake inmate records page explains the Sheriff's inmate lookup, the search fields, and the custody disclaimer. Use that page for a name, a booking number, or a subject number.
Where the Data Comes From
Good population data points back to a source. The local figures here come from the Chesapeake Sheriff's annual reports and the City of Chesapeake proposed operating budget. The national and state context comes from the Bureau of Justice Statistics, the Vera Institute, and the Prison Policy Initiative.
When numbers conflict, the official local report wins for local counts, and the federal source wins for national rates. Anyone citing a Chesapeake population figure should name the report and year, since these numbers move and get revised.